Intermediate Trading Course

Ready to move past the basics? Build real trading skills with strategies that work, professional analysis techniques, and risk management that actually protects your money.
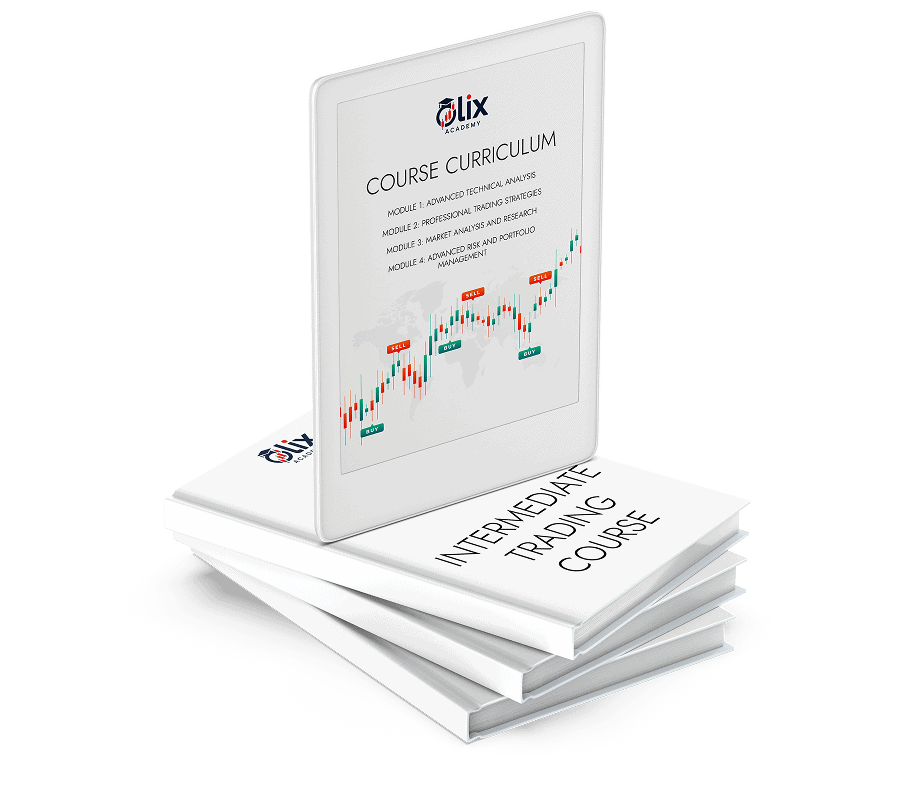
Join Now

A tablet displaying an Intermediate trading course curriculum stands upright on three stacked books labeled "Intermediate Trading Course.
Two softly glowing, overlapping circles of different sizes on a light gray background; the larger circle is on the left, and the smaller is on the lower right.

Course Curriculum

A solid, dark blue circle on a white background.
Module 1:
Advanced Technical Analysis
A blue, right-pointing chevron arrow on a blurred, multicolored background.Complex Chart Patterns – Head and shoulders, triangles, flags, and wedges
A blue, right-pointing chevron arrow on a blurred, multicolored background.Fibonacci Analysis – Retracements, extensions, and time zones
A blue, right-pointing chevron arrow on a blurred, multicolored background.Elliott Wave Theory – Understanding market psychology through wave patterns
A blue, right-pointing chevron arrow on a blurred, multicolored background.Volume Profile Analysis – Reading institutional activity and key levels
A blue, right-pointing chevron arrow on a blurred, multicolored background.Multi-Timeframe Analysis – Lining up trades across different time horizons

What You Will Learn in the Intermediate Course

Icon of one hand passing a banknote to another hand, symbolizing the act of giving or receiving money, on a dark circular background.
Professional Trading Techniques
A blue power button icon with a vertical line inside a broken circle on a white background.Advanced Charting: Master complex patterns and multi-indicator setups
A blue power button icon with a vertical line inside a broken circle on a white background.Strategy Development: Build and test your own trading systems
A blue power button icon with a vertical line inside a broken circle on a white background.Market Structure: Understand how institutional traders operate
White icon of an open hand holding stacked coins and a bar chart with an upward arrow, on a dark circular background.
Better Analysis Methods
A blue power button icon with a vertical line inside a broken circle on a white background.Intermarket Analysis: Trade using correlations between different asset classes
A blue power button icon with a vertical line inside a broken circle on a white background.Volume Analysis: Read order flow and institutional footprints
A blue power button icon with a vertical line inside a broken circle on a white background.Sentiment Analysis: Time the market better by reading psychology
Icon of a clipboard with a magnifying glass over a dollar sign and a bar graph with an upward arrow, representing financial analysis or business growth.
Real-World Application
A blue power button icon with a vertical line inside a broken circle on a white background.Live Market Analysis: Weekly sessions analyzing current market conditions
A blue power button icon with a vertical line inside a broken circle on a white background.Trade Planning Workshop: Create detailed trading plans for different scenarios
A blue power button icon with a vertical line inside a broken circle on a white background.Risk Optimization: Fine-tune position sizing for better results

Course Structure and Learning Paths

We offer flexible learning options to suit your schedule and learning style:
Course Type
Self-Paced Online
Weekly Q&A Sessions
Practice Exercises
Community Forum
Description
Video lessons, quizzes, and practical exercises you can complete anytime
Live sessions with instructors to answer your questions
Hands-on activities using demo trading accounts
Connect with fellow beginners and share your learning journey

Why Choose Olix Academy for Intermediate Trading Education?

A magnifying glass highlighting a line graph with data points, set against a dark circular background.
Bridge to Real Trading
We don’t just teach theory – we show you how to make money in actual markets with proven techniques.
A computer monitor displaying a candlestick chart and an upward trending arrow, representing financial data or stock market analysis.
Track Record That Matters
A blue power button icon with a vertical line inside a broken circle on a white background.Strategies tested through different market conditions
A blue power button icon with a vertical line inside a broken circle on a white background.Instructors who actually trade (and show results)
A blue power button icon with a vertical line inside a broken circle on a white background.Real student success stories with real numbers
A blue power button icon with a vertical line inside a broken circle on a white background.Focus on steady profits, not home runs
Icon showing a laptop, tablet, and smartphone with check marks on their screens, representing intermediate device compatibility or multi-device approval.
Everything You Need
A blue power button icon with a vertical line inside a broken circle on a white background.Trading tools and calculators that work
A blue power button icon with a vertical line inside a broken circle on a white background.Strategy templates you can use right away
A blue power button icon with a vertical line inside a broken circle on a white background.Professional-grade performance tracking
A blue power button icon with a vertical line inside a broken circle on a white background.Market research you won’t find elsewhere
A hand holding up an intermediate-level graph and arrow.
Always Improving
A blue power button icon with a vertical line inside a broken circle on a white background.Monthly strategy updates based on what’s working now
A blue power button icon with a vertical line inside a broken circle on a white background.Quarterly workshops on new opportunities
A blue power button icon with a vertical line inside a broken circle on a white background.Annual conference for networking
A blue power button icon with a vertical line inside a broken circle on a white background.Ongoing education to stay sharp

Student Success Stories

“I knew absolutely nothing about trading when I started. The course explained everything so clearly that I felt confident to start practicing within just a few weeks. The step-by-step approach was perfect for someone like me.”
 – Jennifer M., Teacher
“I knew absolutely nothing about trading when I started. The course explained everything so clearly that I felt confident to start practicing within just a few weeks. The step-by-step approach was perfect for someone like me.”
 – Jennifer M., Teacher
A collage of fourteen individual headshots of men and women, each inside a circular frame, arranged in a scattered pattern on a light background, showcases an intermediate level of diversity and expression.

Course Investment and Value

Intermediate Trader Package: £597
What’s Included:
A blue power button icon with a vertical line inside a broken circle on a white background.40+ video lessons (15+ hours of content)
A blue power button icon with a vertical line inside a broken circle on a white background.PDF guides and strategy templates
A blue power button icon with a vertical line inside a broken circle on a white background.Monthly performance review clinics
A blue power button icon with a vertical line inside a broken circle on a white background.12 live trading sessions (recorded if you miss them)
A blue power button icon with a vertical line inside a broken circle on a white background.4 strategy workshops to build your system
A blue power button icon with a vertical line inside a broken circle on a white background.Trading calculators and tools
A blue power button icon with a vertical line inside a broken circle on a white background.Private intermediate trader community
Payment Options:
A blue power button icon with a vertical line inside a broken circle on a white background.Full Payment: £597 (save £100 – includes bonus indicators package)
A blue power button icon with a vertical line inside a broken circle on a white background.3-Month Plan: £219 x 3 payments
A blue power button icon with a vertical line inside a broken circle on a white background.Graduate Discount: £497 for Olix beginner course graduate

60-Day Performance Guarantee

If your trading doesn’t measurably improve within 60 days, get a full refund.
ORDER COURSE

Gold and black seal displaying "60 Day Money Back Guarantee" in bold capital letters—ideal reassurance for intermediate buyers seeking confidence in their purchase.
A solid, dark blue circle on a white background.

Frequently Asked Questions

A blue, right-pointing chevron arrow on a blurred, multicolored background.
I’m still breaking even. Is this course right for me? 

Perfect! This course is made for traders who get the basics but can’t seem to get consistently profitable. We focus on what turns break-even traders into winners.

Ready to Get Serious About Trading?

Next Steps:
A simple black line drawing of two vertical parallel lines with two short diagonal lines extending from the top left side.
Take our free trading assessment
A black number two written in a simple, cursive style on a light gray background.
Sign up for the Intermediate Trader Package
A black hand-drawn number three on a light gray background.
Check off the
prerequisites
A minimalist, black outline drawing of the number 4 on a light gray background.
Start with Module 1: Advanced Technical Analysis
A black outline of the number five on a plain white background.
Join traders who are
actually making money
Enroll Today

Join us today

Join successful traders who went from breaking even to consistently profitable with Olix Academy’s proven methods.