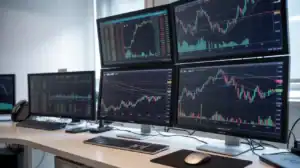
Article Summary MTA separates two different jobs — reading market direction belongs to the higher timeframe; timing entries belongs to the lower timeframe. Mixing these two tasks in one chart is why technically clean setups fail. The higher timeframe sets a bias, not a signal — professionals use the daily or weekly chart to establish […]
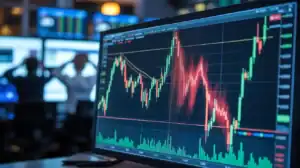
Article Summary False breakouts are structural, not random — they happen because liquidity and stop-loss clusters concentrate at predictable levels, and larger players exploit that deliberately. The most dangerous fakeouts share a recognisable pattern — weak breakout candle, thin volume, no retest, and a choppy market behind it. Round numbers and obvious resistance are fakeout […]
Article Summary Liquidity is not about price direction — it measures how easily you can buy or sell an asset without the price moving against you in the process. The bid-ask spread is your fastest liquidity check — a tight spread means a liquid market; a wide spread means you are already paying a hidden […]
Starting capital requirements vary dramatically across different trading markets, from as little as $10 for forex micro accounts to $25,000 for U.S. pattern day trading in stocks. The amount you need depends on your chosen market, trading style, broker requirements, and risk management strategy rather than a universal figure. What Determines Your Minimum Trading Capital? […]
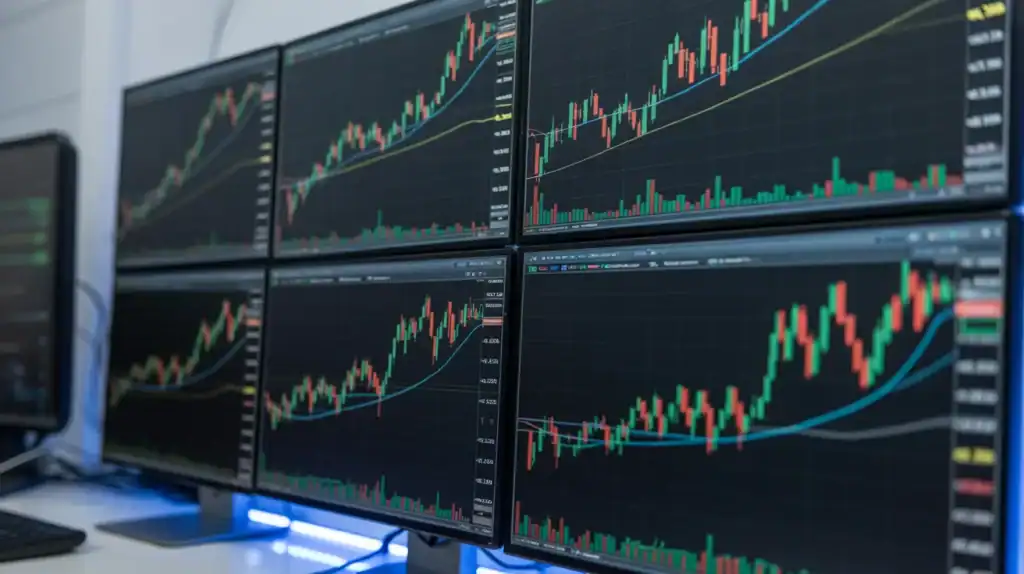
Chart clutter destroys trading performance by creating analysis paralysis, conflicting signals, and delayed decision-making. Professional traders limit their technical analysis to 2-4 complementary indicators that measure different market dimensions, avoiding the 78% accuracy reduction that occurs when 5+ redundant tools compete for attention. What causes indicator overload on trading charts? Indicator overload occurs when traders […]
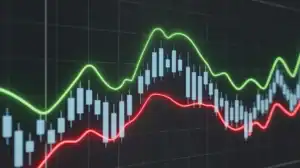
What Are Leading and Lagging Indicators in Trading? Leading indicators attempt to predict future price movements before they occur. These tools measure market conditions that typically change before price action confirms a trend. Traders use leading indicators to enter positions early, capturing maximum profit potential from the beginning of a new trend or reversal. Lagging […]
Article Summary The forex market never closes, but most of the opportunity does — around 70% of forex trading volume is concentrated in the London and New York sessions, leaving the rest of the day comparatively thin. The London–New York overlap is the single most active window — when both sessions run simultaneously (roughly 1pm–5pm […]
Trading and investing are two distinct methods of participating in financial markets. Both involve buying assets, but they differ in time horizon, analysis method, risk exposure, capital requirements, and tax treatment. Understanding these differences helps beginners allocate capital according to their goals, schedule, and risk tolerance. What Is the Core Difference Between Trading and Investing? […]
Most traders put an EMA on their chart and then stare at it, waiting for something obvious to happen. The line slopes up, price hovers nearby, and they still manage to enter too late, too early, or not at all. The indicator is not the problem. The problem is not knowing exactly what the EMA […]
Moving averages are the oldest continuously used tool in technical analysis – and the most misunderstood. Traders who treat them as mechanical buy/sell generators consistently lose money in sideways markets. Traders who understand what moving averages actually measure – the momentum-weighted consensus price over a defined period – use them to stay on the right […]